04 - Working with Advanced Waveform Analysis Flows
The following flows are targeted for those users, who have electronics components as large part of a design. For all the following flows, simulation will happen in PSpice only and you will not be required to see MATLAB until you want to export PSpice trace data to MATLAB for specialized plotting.
The PSpice - MATLAB flows covered in this chapter are:
- Using MATLAB Visualization Capabilities in PSpice
- Calling the MATLAB function in PSpice
- Using the MATLAB-Based Measurement Function in PSpice
Using MATLAB Visualization Capabilities in PSpice
The new PSpice - MATLAB interface provides some of the best capabilities of MATLAB for specialized plotting. You can export the PSpice trace data to MATLAB and generate various plots, such as polar plots and 3D Plots.
Before you start using the MATLAB visualization capabilities in PSpice, ensure that you have set the MATLAB path and started the MATLAB engine. To know more about the setting the MATLAB path and starting the MATLAB engine, see the Setting Up the PSpice - MATLAB Flow for Advanced Waveform Analysis chapter.
In the Export to MATLAB window, you can do one or more of the following:
- Select one or more traces that you want to export to MATLAB for advanced plotting and visualization.
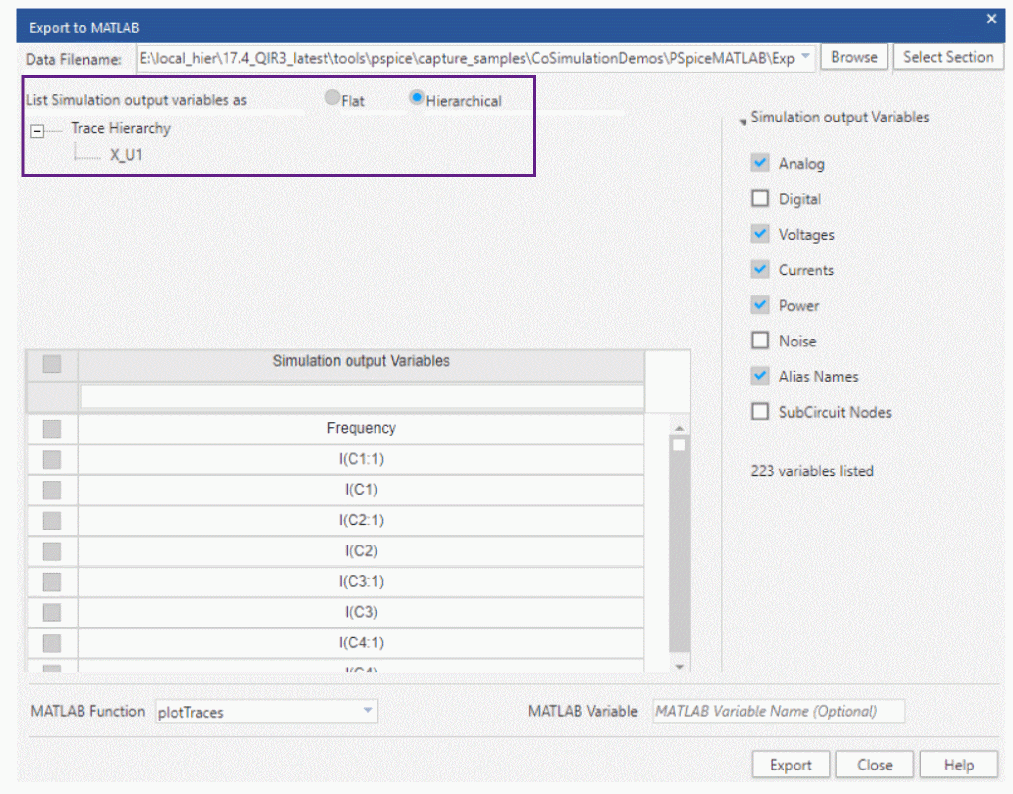
- Select the simulation output variable as Flat or Hierarchical. The following screen shot illustrates the hierarchical structure of the simulation output variables:
- Use the default MATLAB-based function, plotTraces, to plot traces with respect to time in a figure panel.
- Provide a different name, such as TRAN, MyVAR, to the generate a MATLAB variable instead of the default variable created (PSpiceData_<instance_number>). To do that, specify the variable name in the MATLAB Variable field.
If you name the MATLAB variable using the MATLAB Variable field, ensure that the first character of this variable is an alphabet.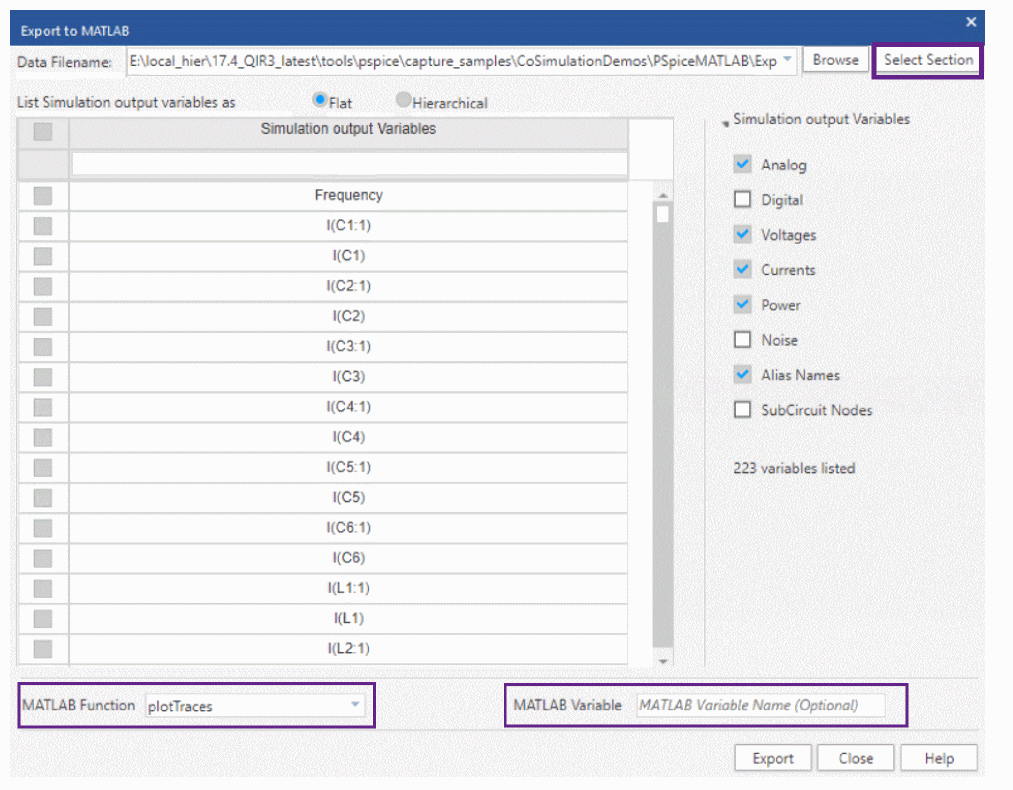
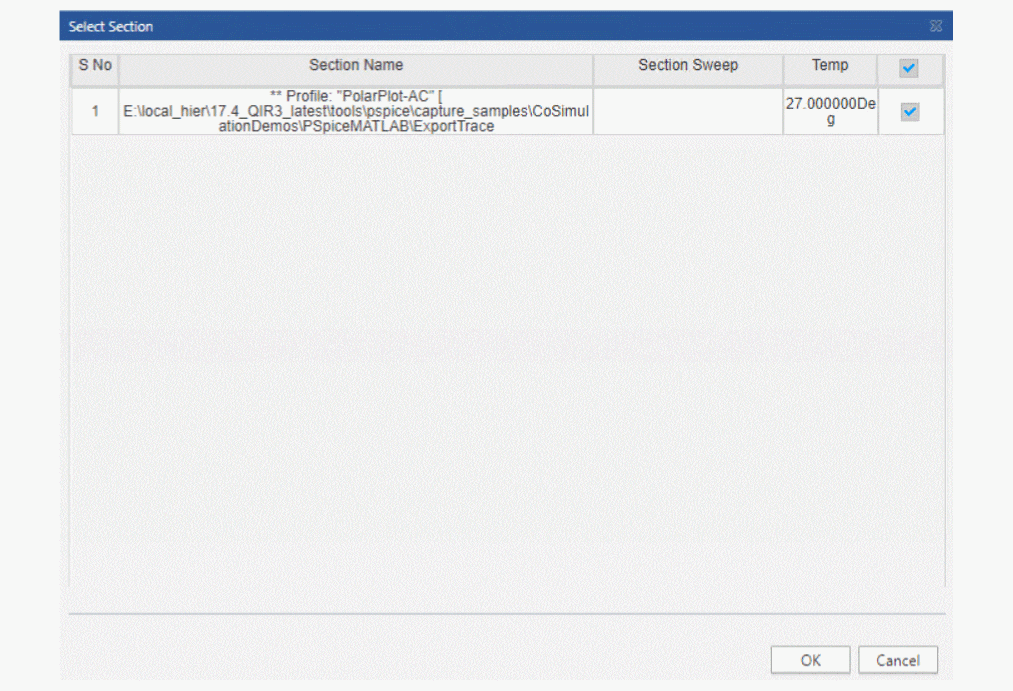
- Select one or more sections from the multi-section simulation data using the Select Section button.
It is recommended to select the Export Selected Traces option to select a set of traces, if the PSpice data file size is more than 800 MB.
Measurement expressions are not exported to MATLAB because output of a measurement expressions is a single value.
Exporting of traces to MATLAB for Advanced Waveform Analysis
Use the PSpice - MATLAB interface to export a set of traces to MATLAB for Advanced Waveform Analysis. With this feature, you can:
- Generate special plots in MATLAB by directly exporting PSpice simulation results
- Generate special plots in MATLAB by exporting all traces
- Generate customized plot using a MATLAB script
Generate special plots in MATLAB by directly exporting PSpice simulation results
In this section, a design project, pspicematlab_exporttrace.opj, shipped with PSpice installation is used to explain how to generate special plots.
Procedure
- Launch Capture.
- Navigate to the location of the design project:
<installation_directory>\tools\pspice\capture_samples\CoSimulationDemos\PSpiceMATLAB\ExportTrace - Select and project a project.
In this example, select: pspicematlab_exporttrace.opj - Select BHCurve and simulate the design.
The simulation results open in PSpice along with the Available Sections window. - Click All to select all the sections and then click OK.
The following figure shows the simulation results in PSpice.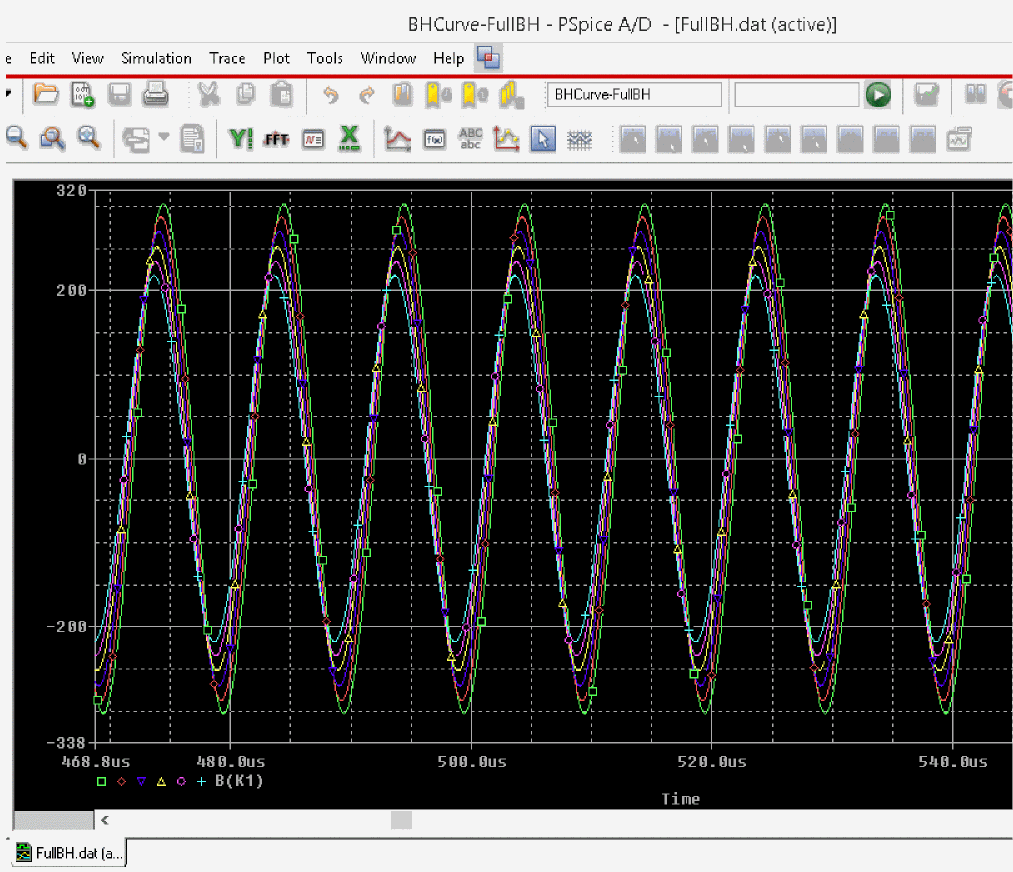
- To start the MATLAB engine, select Tools – MATLAB – Start MATLAB Engine.
The MATLAB Command Window appears. - Select Tools – MATLAB – Export Selected Traces to export selected traces to MATLAB after you have simulated the schematic design.
The Export to MATLAB window appears. - Click the Select Section button to select the sections that you want to use to export the trace data. This step is optional.
If you have multi-section simulation, you can select one or more sections from the Select Section window and click OK.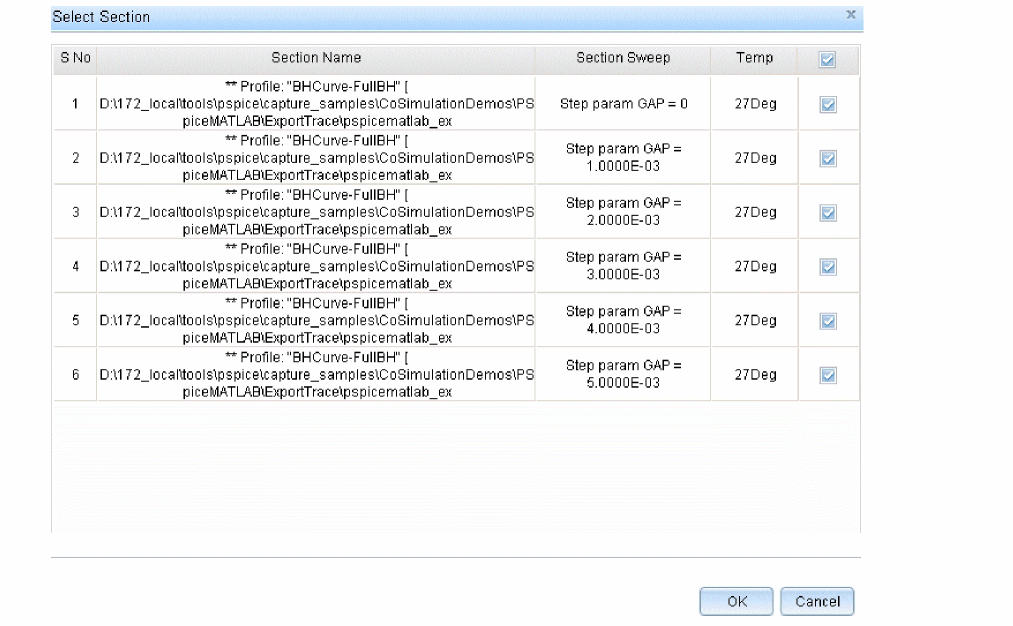
- Select the traces you want to export to MATLAB.
In this procedure, the default function, plotTraces, is used to plot the selected traces in the MATLAB plot window.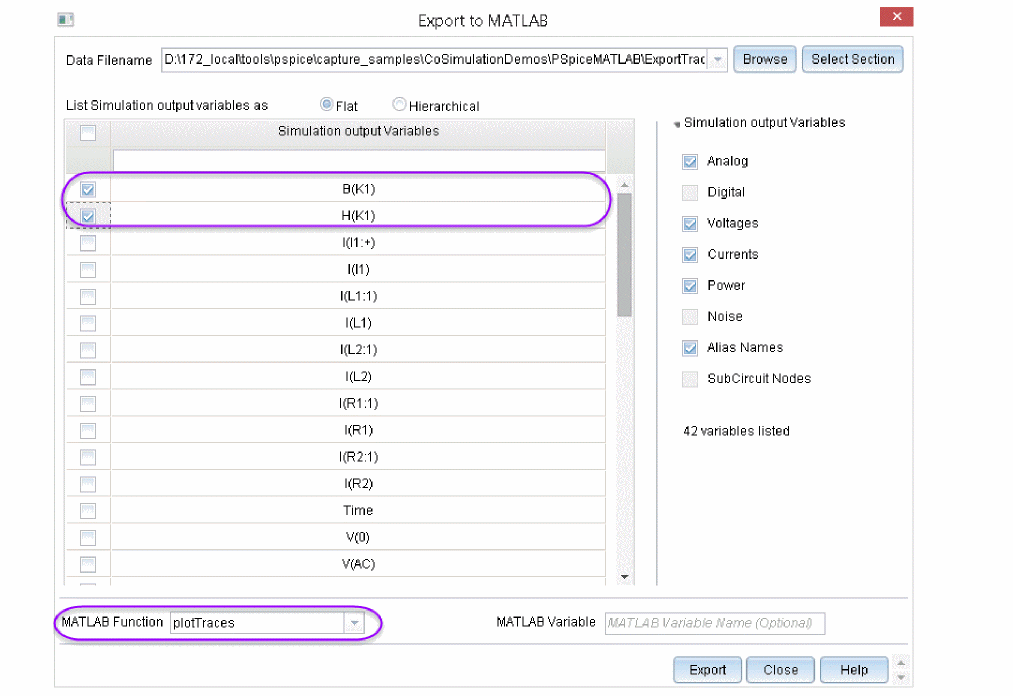
- Specify the MATLAB Variable name that will have all the exported trace data. This step is optional.
In case, you have not specified any variable name, a default MATLAB variable will be generated. - Once you have selected the traces, click the Export button.
If you have not started the MATLAB Engine, you will see the MATLAB command window getting displayed. Also, a MATLAB figure panel is displayed with trace plot of the selected trace with respect to time.
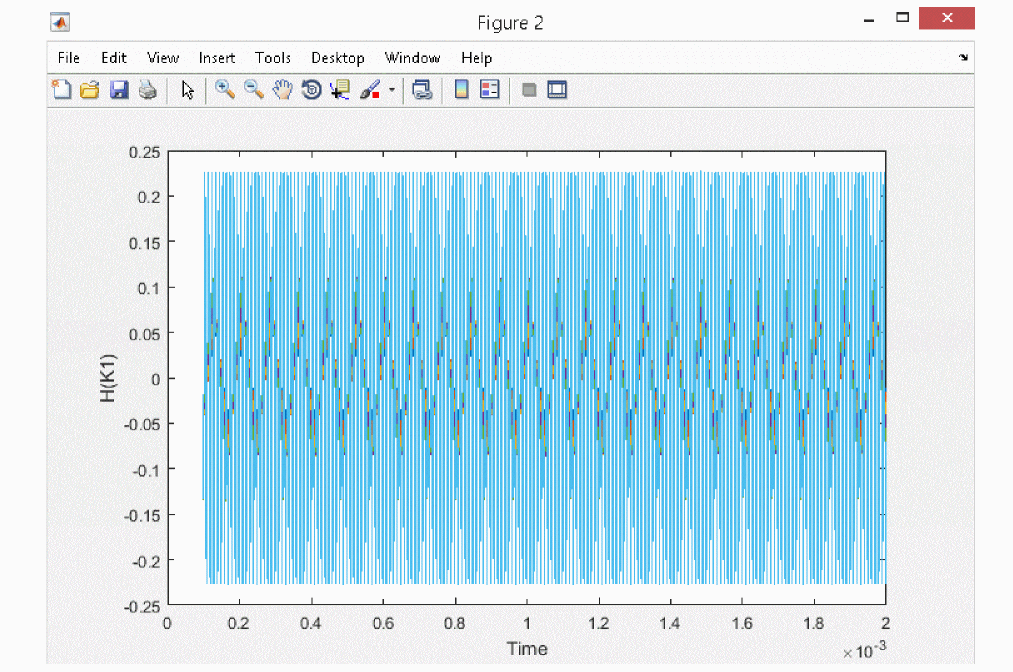
Once you export the trace data to MATLAB, a MATLAB variable is generated, (PSpiceData_<instance_number>) if you have not specified any in the MATLAB Variable field. The instance number gets incremented every time you export a new trace data to MATLAB. The following screen shots shows the plots generated using the default plotTraces function: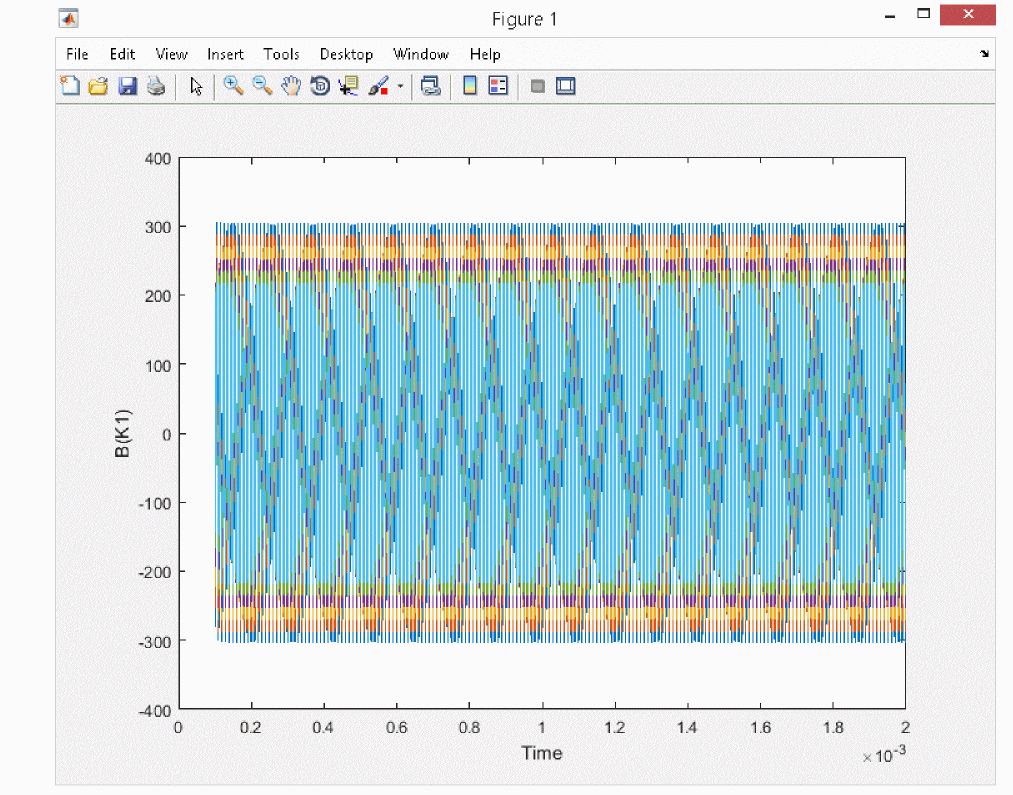 The MATLAB variable generated is a structured array, which can be used later in MATLAB using various customized functions.
Some customized MATLAB scripts, which can be used to access the PSpice trace data from the MATLAB variable, are at the following location: <installation_directory>\tools\pspice\tclscripts\orPSPMatlab\MatlabScripts. For more information on how to access the trace data from the generated MATLAB variable, see the Accessing Trace Data from the MATLAB Variable chapter.
It is recommended to save your data in MATLAB before you close the MATLAB Command Window. Otherwise all the trace data, including variables generated, will be lost.
Generate special plots in MATLAB by exporting all traces
In this section, a design project, pspicematlab_exporttrace.opj, shipped with PSpice installation is used to explain how to export all traces.
Procedure
- Launch Capture.
- Navigate to the location of the design project:
<installation_directory>\tools\pspice\capture_samples\CoSimulationDemos\PSpiceMATLAB\ExportTrace - Select and project a project.
In this example, select: pspicematlab_exporttrace.opj - Select BHCurve and simulate the design.
The simulation results open in PSpice along with the Available Sections window. - Click All to select all the sections and then click OK.
- To start the MATLAB engine, select Tools – MATLAB – Start MATLAB Engine.
The MATLAB Command Window appears. - Select Tools – MATLAB – Export All Traces to export all the traces to MATLAB after you have simulated the schematic design.
The MATLAB Command Window appears. - Type the desktop command to open the desktop version of MATLAB.
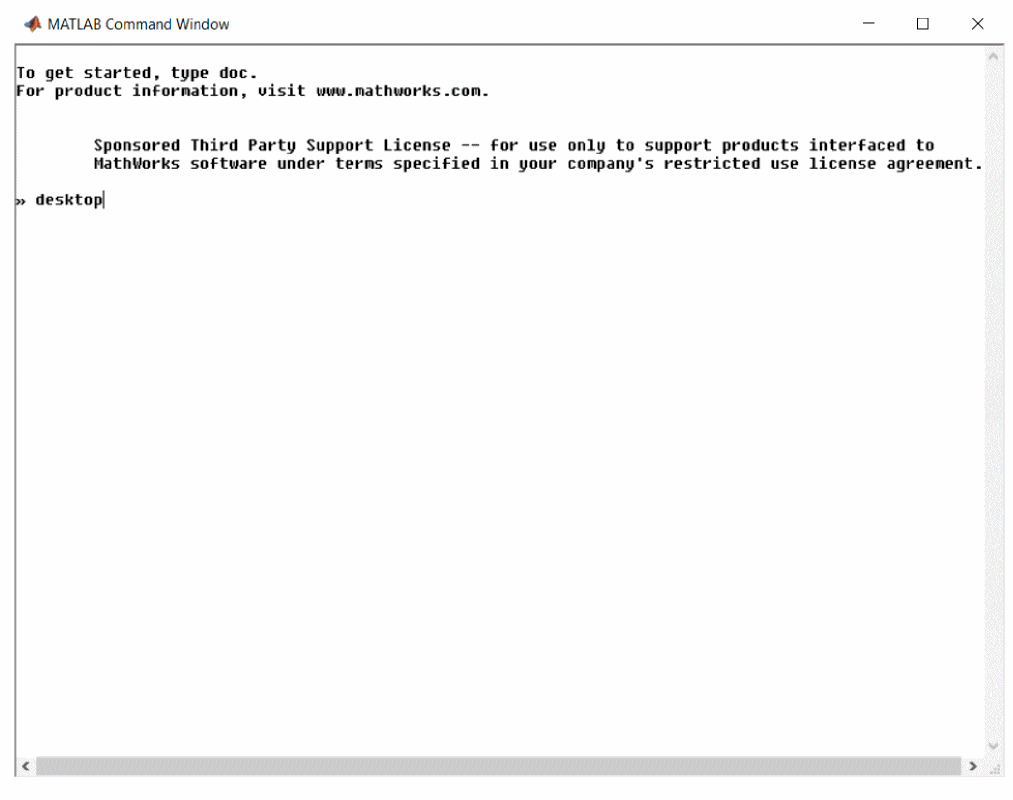
In the desktop version of MATLAB, you can view that all the traces are exported under the MATLAB variable, PSpiceData_1.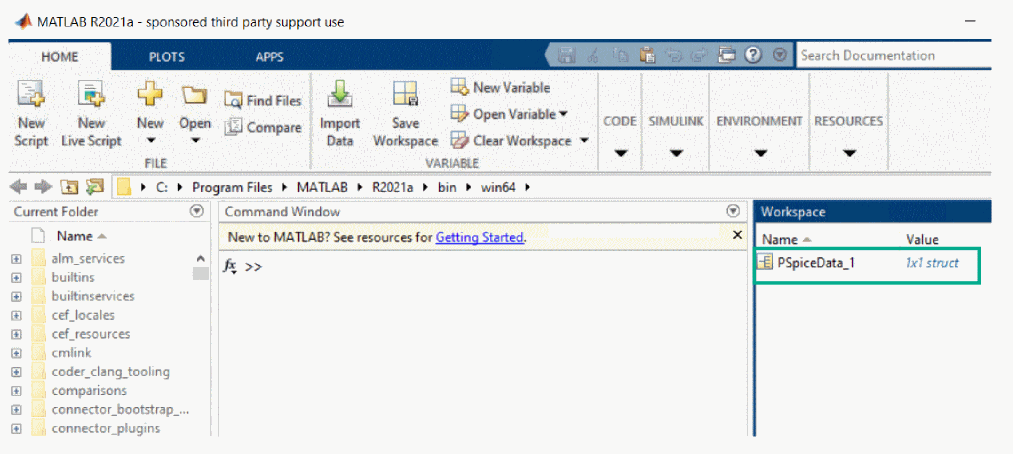
Generate customized plot using a MATLAB script
PSpice allows you to add your customized MATLAB plotting functions and use them through the Export to MATLAB window. Using customized MATLAB functions, you can visualize different plots other than the default one (created using the plotTraces function).
For example, you can use customized function to create a polar plot or 3D plot that can help in understanding the data in more detail.
A customized MATLAB function must be saved as MATLAB script (.m) file.
In this section, a design project, pspicematlab_exporttrace.opj, shipped with PSpice installation is used to explain how to generate custom plots.
Procedure
- Launch Capture.
- Navigate to the location of the design project:
<installation_directory>\tools\pspice\capture_samples\CoSimulationDemos\PSpiceMATLAB\ExportTrace - Select and open a project.
In this example, select: pspicematlab_exporttrace.opj - Select BHCurve and simulate the design.
The simulation results open in PSpice along with the Available Sections window. - Click All to select all the sections and then click OK.
The following figure shows the simulation results in PSpice.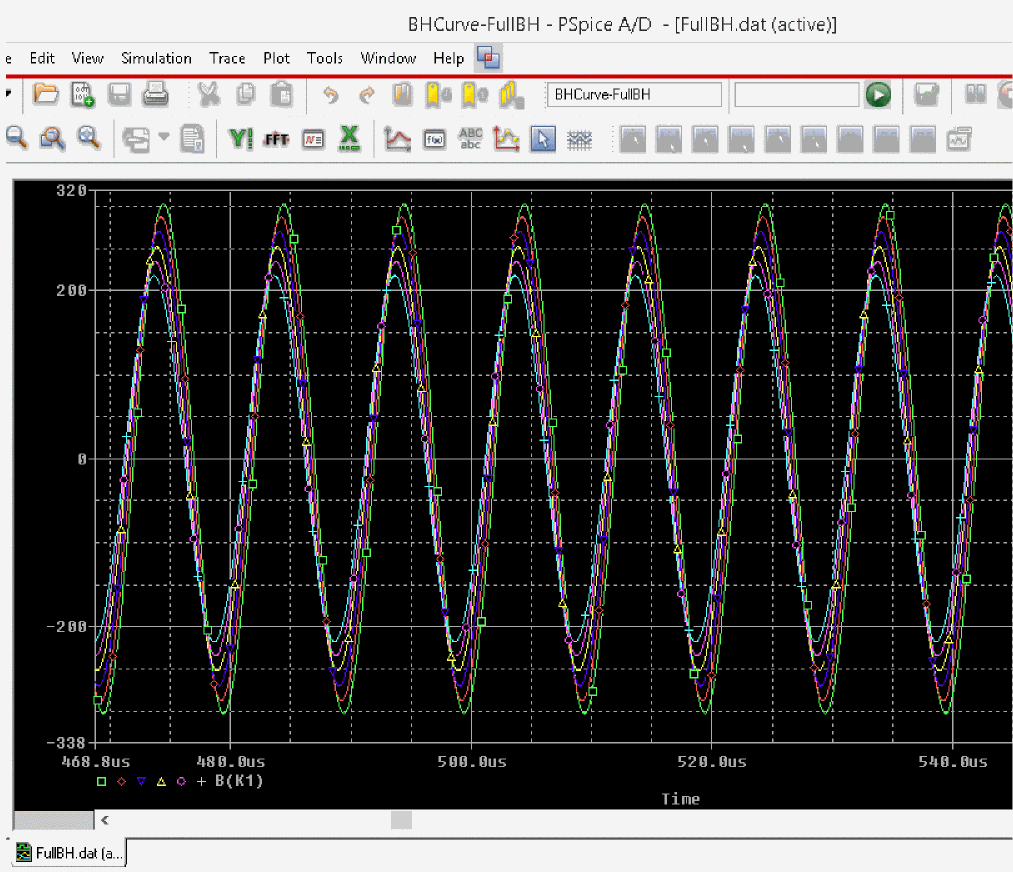
- To start the MATLAB engine, select Tools – MATLAB – Start MATLAB Engine.
The MATLAB Command Window appears. - Type the desktop command to open the desktop version of MATLAB.
- In the HOME tab, click Set Path.
The Set Path window appears. - Click the Add Folder button and browse to the location of the custom MATLAB script:
<installation_directory>\tools\pspice\capture_samples\CoSimulationDemos\PSpiceMATLAB\ExportTrace\MATLAB_SCRIPTs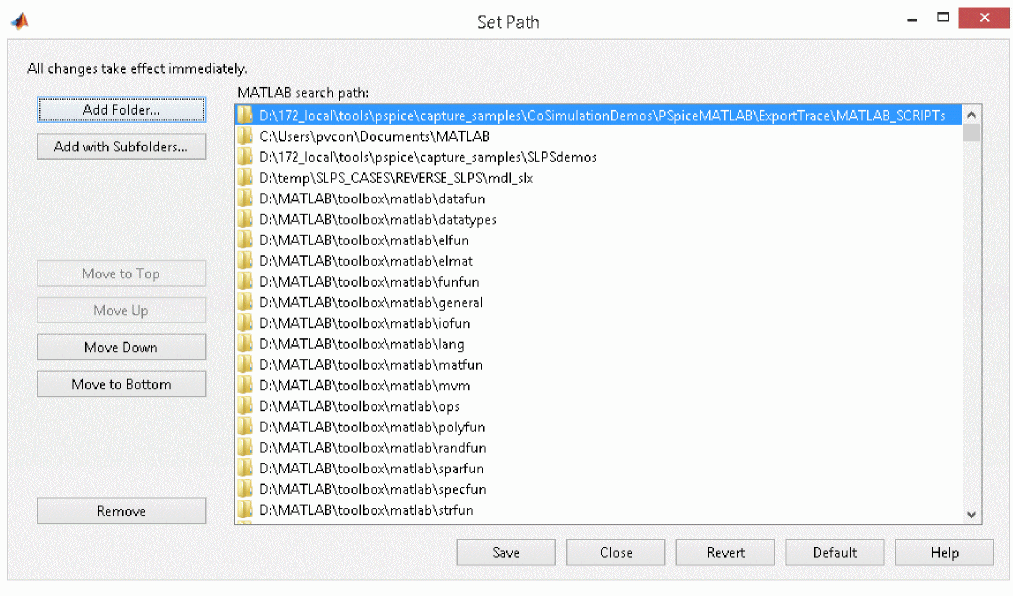
- Click Save.
- In PSpice, select Tools – MATLAB – Export Selected Traces to export selected traces to MATLAB.
The Export to MATLAB window appears. - Click the Select Section button to select the sections that you want to use to export the trace data. This step is optional.
If you have multi-section simulation, you can select one or more sections from the Select Section window and click OK.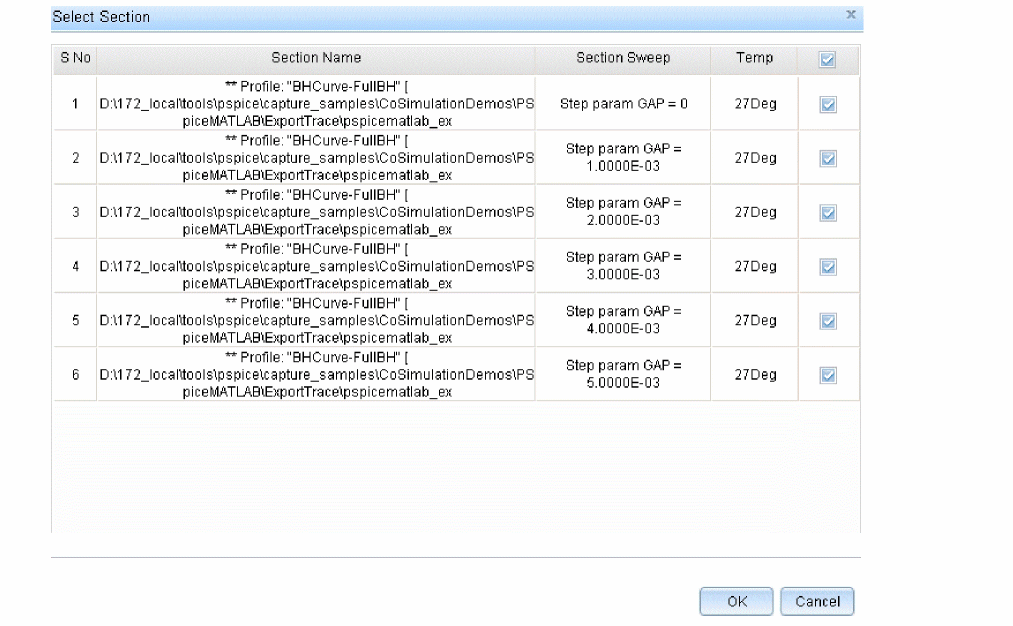
- Select the traces you want to export to MATLAB.
In this example, select the traces, B(K1) and H(K1) under simulation output variable. - Specify a custom MATLAB function, BHPLOT(BHDATA), to plot the selected traces in the MATLAB plot window.
- Specify the MATLAB variable name, BHDATA, which will save all the exported trace data.
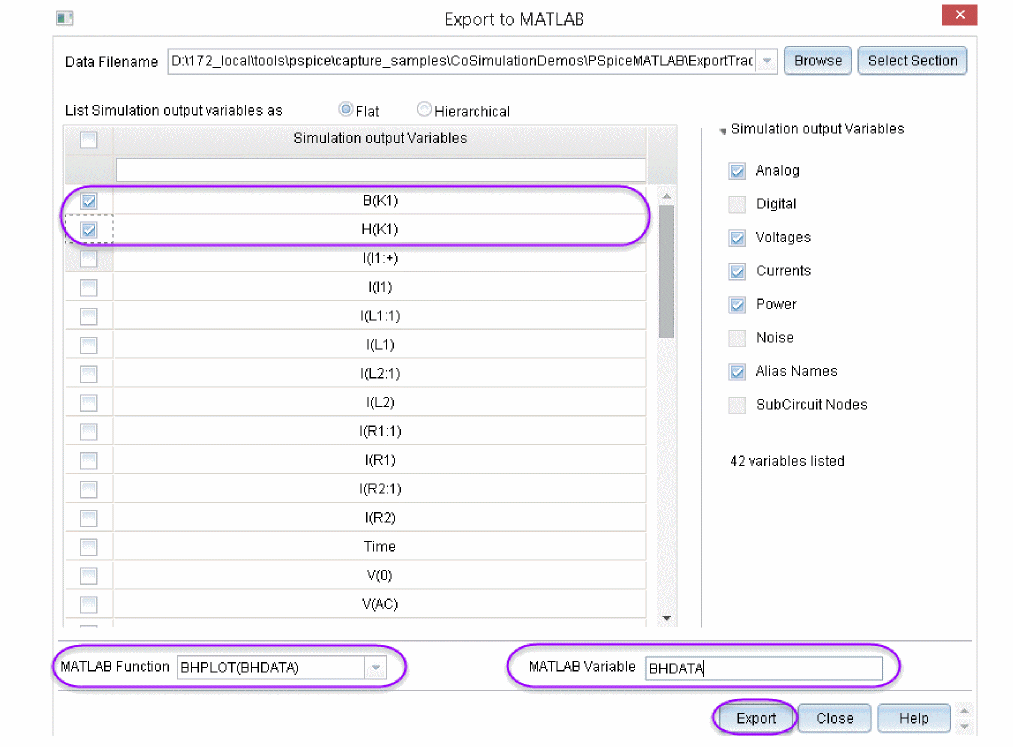
- Click the Export button.
A MATLAB figure panel is displayed with trace plot of the selected trace with respect to time.If you have not started the MATLAB Engine, you will see the MATLAB command window getting displayed.
For this example, the following screen shot shows the BH plots that are generated with airgap values from 0 to 5 mm.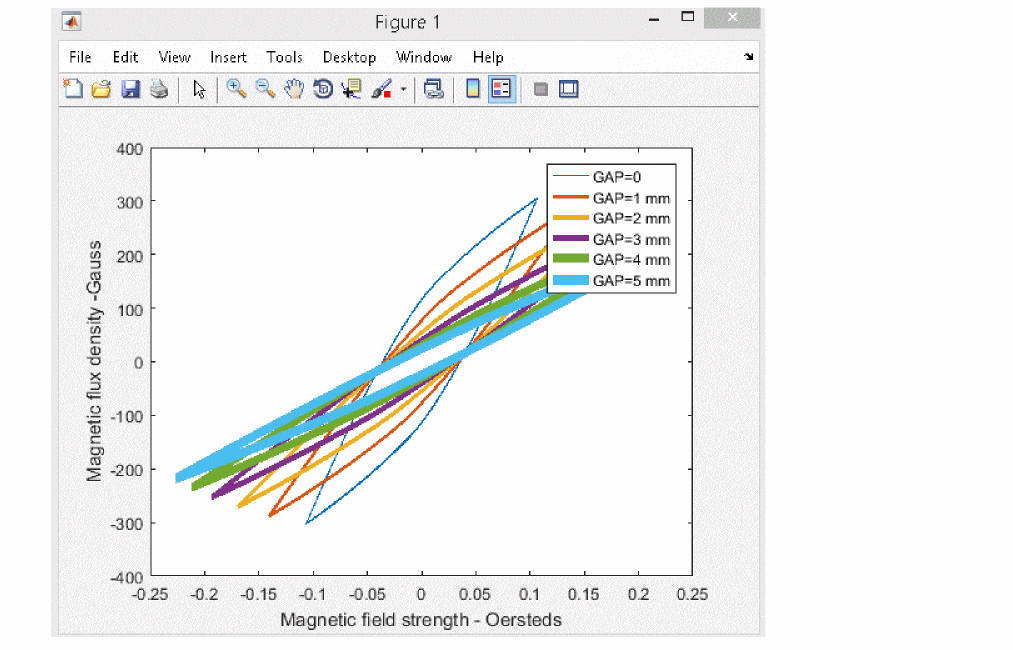
Calling the MATLAB function in PSpice
PSpice allows you to add various function for the behavioral controlled devices. These functions can be related to mathematical expressions, laplace transformations, logarithmic function and many more.
PSpice allows you to add a MATLAB function in the expression for the E and G behavioral controlled devices.
Where:
- E: Voltage Controlled Voltage Source
- G: Voltage Controlled Current Source
For more information, see PSpice A/D Reference Guide.
Various MATLAB functions can be added using the following syntax:
MATLABFUNCTION(<MATLAB_function>, <Parameter_1>, <Parameter_2>, <number_of_parameters>)
Where:
- <MATLAB_function>: Is the name of the function in MATLAB
- <Parameter_1> and <Parameter_2>: Are arguments used in <MATLAB_function>
- <number_of_parameters>: number of arguments used in <MATLAB_function>
Remember the following points before you use MATLABFUNCTION in PSpice:- You should correctly spell the <MATLAB_function> else simulation will abort or nothing will be displayed on the probe window. Similarly, correctly mention the number of arguments else you will get a simulation error.
- The <number_of_parameters> defines the number of arguments that the <MATLAB_function> can take in the MATLABFUNCTION function. If the <MATLAB_function> used in MATLABFUNCTION has five arguments, the <number_of_parameters> argument will be five.
- The parameter and return type of <MATLAB_function> used in MATLABFUNCTION is constant, not an array or a matrix. The constant values can be one of the following types: integers, double, and float. If parameters other than constant are used, the MATLABFUNCTION function will not simulate.
Example
The following screen shot shows a design example that uses two MATLAB functions in PSpice. You can open this example from the following location:
<installation_directory>\tools\pspice\capture_samples\CoSimulationDemos\PSpiceMATLAB\MATLABFunctions
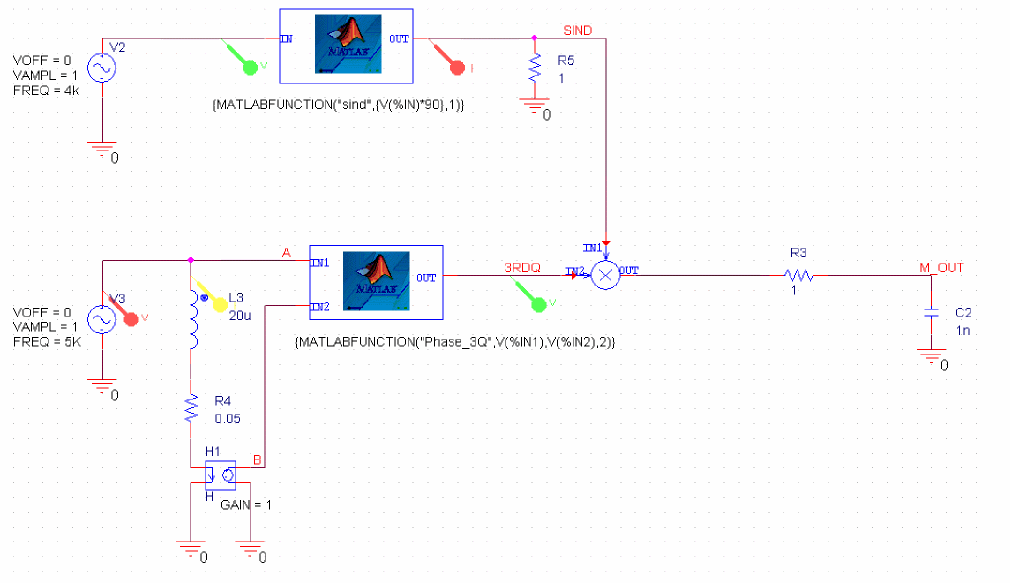
In the first function, {MATLABFUNCTION("sind",{V(%IN)*90},1)}:
- sind is the name of the MATLAB function. This function requires one argument and this is indicated by the last parameter of this expression, which is 1.
- V(%IN)*90 is the argument used in sind.
- 1 defines the number of parameters used in sind.
In the second function, {MATLABFUNCTION("Phase_3Q",V(%IN1),V(%IN2),2)}, which is a user-defined function created in MATLAB:
- Phase_3Q is the name of the user-defined MATLAB function. This function requires two arguments, which is indicated by the last parameter of this expression, 2.
- V(%IN1)and V(%IN2) are the arguments used in Phase_3Q.
- 2 defines the number of parameters used in Phase_3Q.
To perform waveform analysis for this design, do the following:
- If you are using any user-defined or customized MATLAB functions in the design, ensure that you have added the custom MATLAB script folder in the Set Path window of MATLAB. To do so:
- Launch MATLAB R2019b or onwards.
- In the HOME tab, click Set Path.
The Set Path window appears. - Click the Add Folder button and browse to the location of the custom MATLAB script:
For this example, browse to the location: <installation_directory>\tools\pspice\capture_samples\CoSimulationDemos\PSpiceMATLAB\ExportTrace\MATLAB_SCRIPTs - Click Save.
- Launch Capture.
- Navigate to the location of the design project.
For this example, navigate to <installation_directory>\tools\pspice\capture_samples\CoSimulationDemos\PSpiceMATLAB\MATLABFunctions - Select and open the project: matlab_function.opj
The design opens in Capture.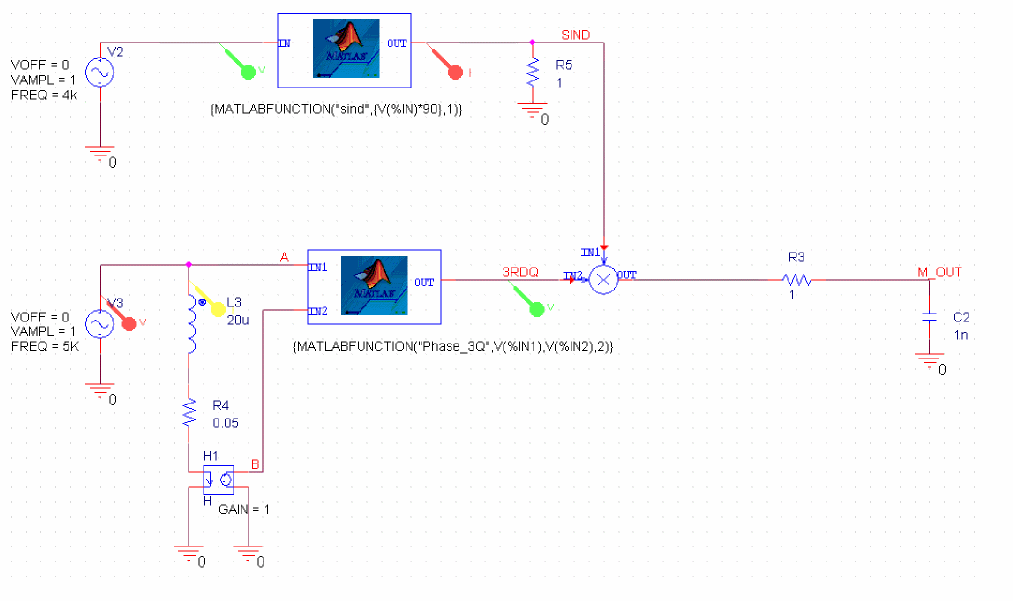
- Run the simulation.
A MATLAB figure panel is displayed with trace plot of the selected trace with respect to time.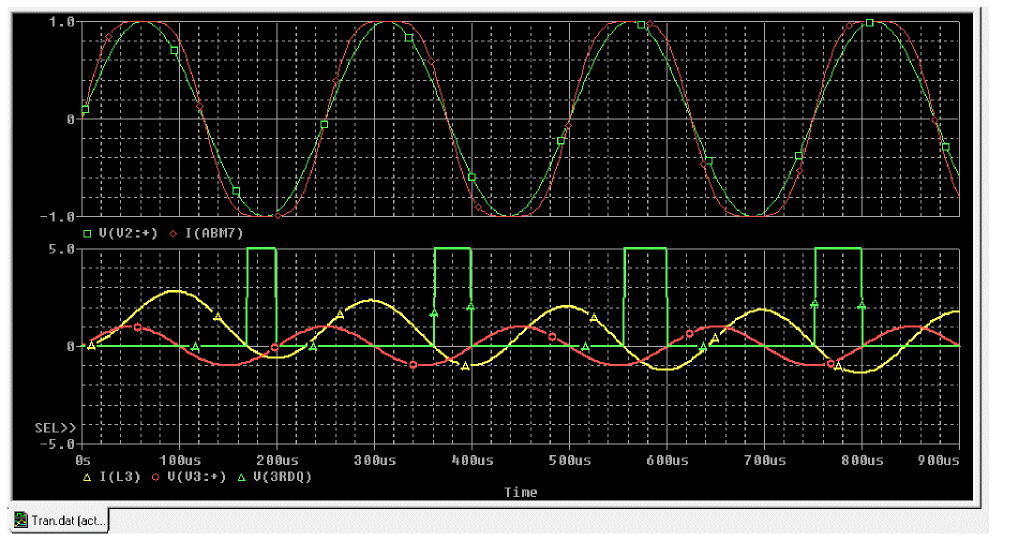
Using the MATLAB-Based Measurement Function in PSpice
PSpice allows you to use various measurement functions to evaluate the characteristics of the waveform generated after simulation is completed. For more information on various measurement functions, see the Measurement Expressions chapter in the PSpice User Guide.
You can use the MATLAB-based measurement functions to evaluate the waveforms generated in PSpice. When these functions are used in PSpice, MATLAB is used in the background to run the measurement functions, which evaluate the selected trace(s).
By default, the following two general purpose MATLAB-based functions have been added in PSpice:
- MATLABFunction1(<trace_name>, <MATLAB_function>)
Where:- <trace_name>: Is the name of the trace in PSpice
- <MATLAB_function>: Is the name of the MATLAB function to be evaluated on <trace_name>
Use this function to call any MATLAB function that uses one argument and returns a constant expression. - MATLABFunction2(<trace_name1>, <trace_name2>, <MATLAB_function>)
Where:- <trace_name1>, <trace_name2>: Are names of the traces in PSpice
- <MATLAB_function>: Is the name of the MATLAB function to be evaluated on <trace_name1> and <trace_name2>
Use this function to call any MATLAB function that uses two arguments and returns a constant expression.
Perform the following steps to evaluate the characteristics of a waveform using the MATLAB-based measurement functions:
- In PSpice, choose Trace – Evaluate Measurement.
The Evaluate Measurement window appears.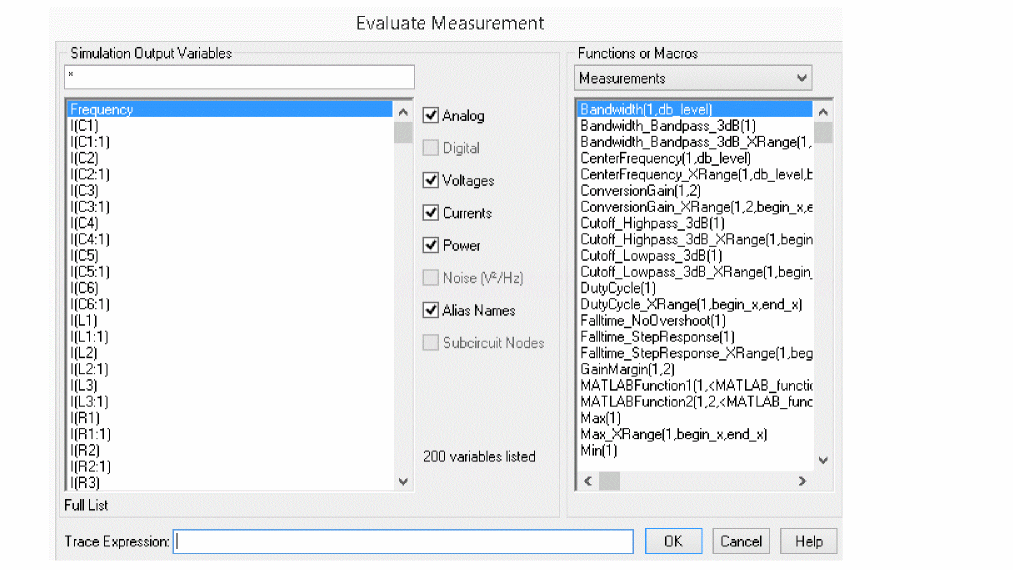
- From the Functions or Macros section, select any one of the two MATLAB- based measurement function.
Once you select the function, the Trace Expression field gets updated in with function’s definition. - Specify the arguments for the selected MATLAB-based measurement function:
- Trace Name: From the Simulation Output Variables section, select the trace. It gets updated in the Trace Expression field.
- Name of the MATLAB function: In the Trace Expression field, specify the name of the MATLAB function.
For MATLABFunction1:- For example: MATLABFunction1(V(out), risetime)
- V(out) is the trace name.
- risetime is the name of the MATLAB function.
For MATLABFunction2:- For example: MATLABFunction2(V(out), I(out), risetime)
- V(out) and I(out) are trace names.
- risetime is the third argument, which is the MATLAB function.
- Click OK.
The measurement function is displayed in the Measurement Results window of the PSpice probe. - Select the measurement function from the Measurement Results window.
The value evaluated is displayed.
Ensure the following before you evaluate a waveform using a MATLAB-based measurement function in PSpice:
- The MATLAB function name is correct.
- The number of arguments mentioned are correct.
For incorrect expressions, PSpice will always return value=0.
View the next document: 05 - Accessing Trace Data from the MATLAB Variable
If you have any questions or comments about the OrCAD X platform, click on the link below.
Contact Us