Know How Your Circuit Works!- Using Sensitivity Analysis In PSpice (Part 1 of 4)
Performing Sensitivity Analysis on a RF Amplifier circuit in PSpice
When in college, books tell you everything about your circuit. You already know which components are critical in your designs. But, what about when you enter an industry? You have completely new designs that you build or come across and you need to know which components are critical for your goals
According to the tolerance values specified, the Sensitivity Analysis in OrCAD simulates circuit performance as those components parametric values change. It gives you an ordered list of critical components in your design. As a result, this allows you to save money by loosening the tolerance on those components which are not very critical for your goals and selecting cheaper ones.
Let's look at why a circuit designer would perform Sensitivity analysis on his/ her circuit design
Importance of Sensitivity Analysis:
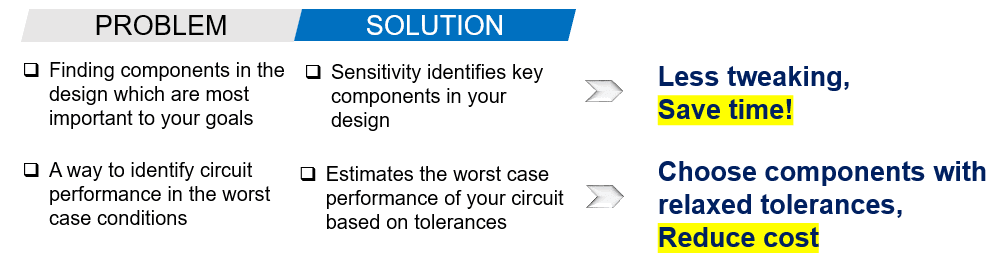
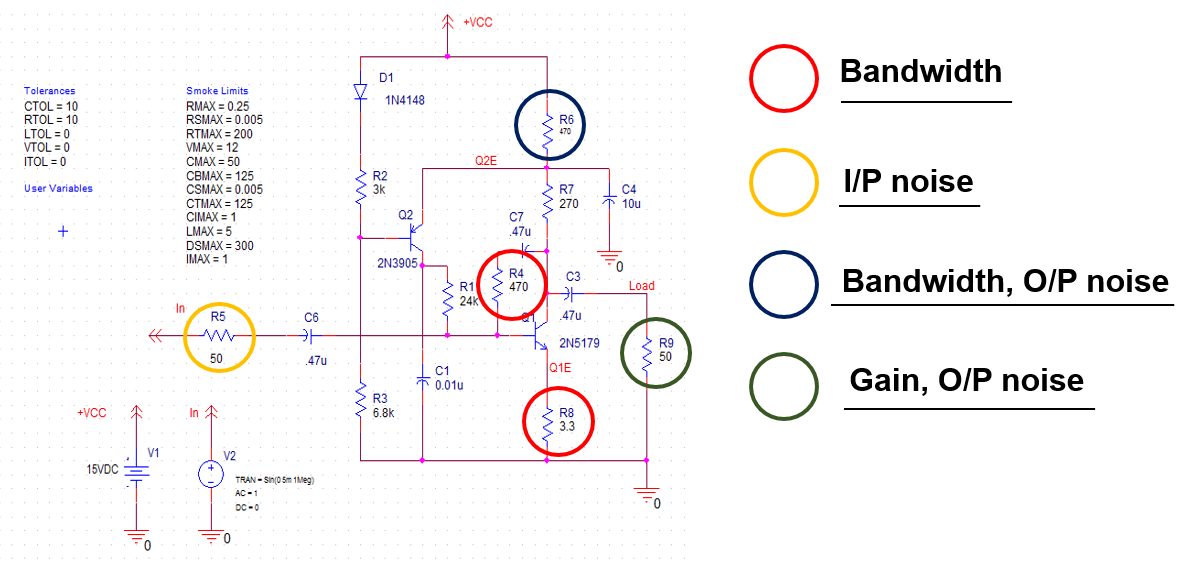
A sample RF Amplifier circuit for this blog is shown in Figure 1 (below). We will perform Sensitivity Analysis on it and understand the results.
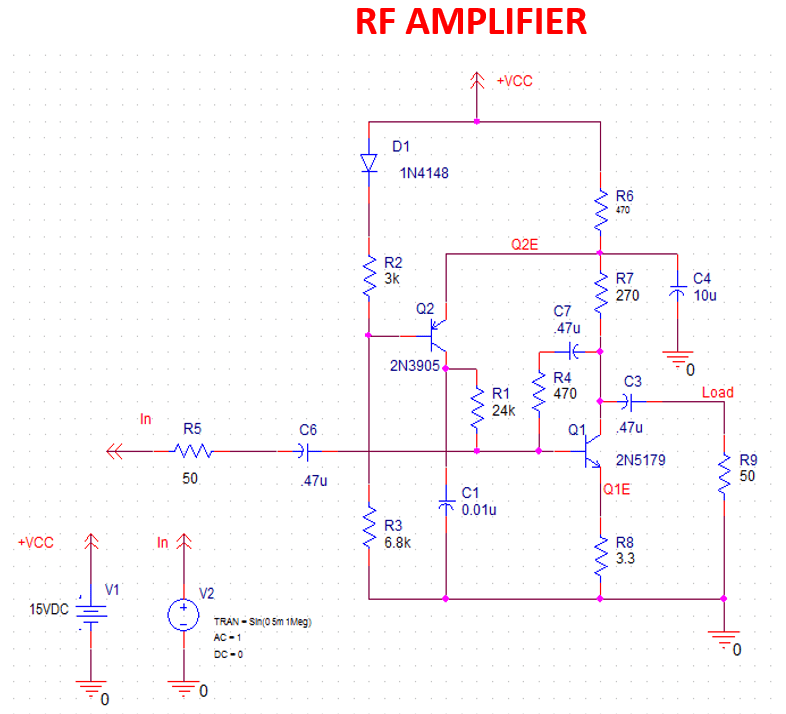
Figure 1: Sample RF Amplifier circuit
The main parameters to be considered for any RF circuit are:
- Bandwidth
- Gain
- O/P Noise Level
- I/P Noise Level
So, how do you perform Sensitivity Analysis? What are the steps to be followed? Let's look at the flow...
Flow for performing Sensitivity Analysis:
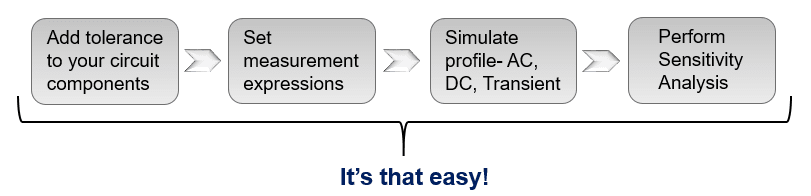
You have got to set your circuit up for the Sensitivity Analysis (below)
Sensitivity Analysis Circuit Setup:
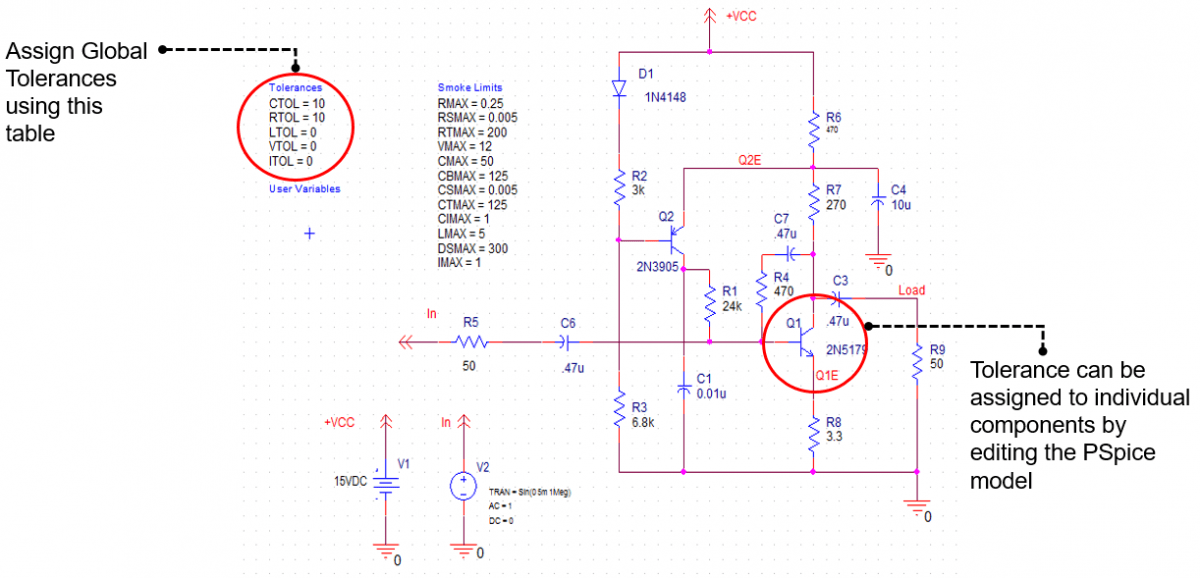
Figure 2: Assign tolerances to the RF Amplifier Circuit
Sensitivity analysis varies the values of components based on the tolerance value specified and shows you the effect of those components on the measurement goals. In Figure 2, note that we have assigned 10% global tolerances to all capacitors and resistors in our circuit. Next, perform Sensitivity Analysis on this circuit and let the tool do the magic. The output window would look like Figure 3.
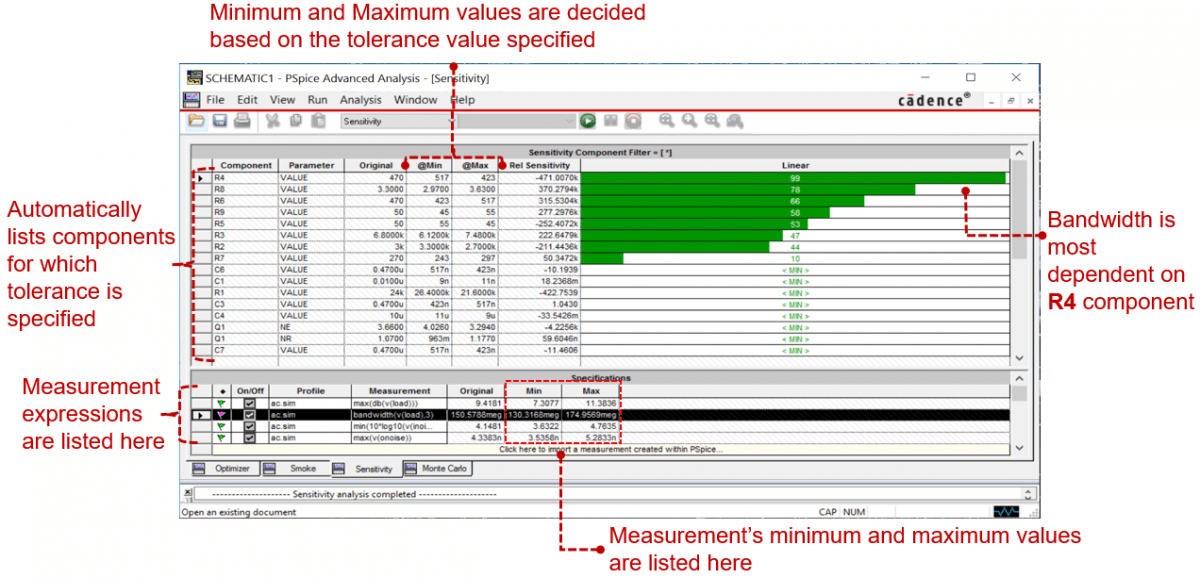 Figure 3: Output window after performing Sensitivity Analysis
The components are listed in order of their effect on the measurement goal. The most critical component for a measurement are listed at top of the list. In Figure 3, I have selected Bandwidth as the main goal and note that it is most dependent on the value of R4 component.
Sensitivity Analysis in OrCAD identified all the key components in the design based on the goals specified.
Key Components Identified:
Now, that we've identified key components in the design, let’s set some goals for Bandwidth, Gain, Output level noise and Noise Figure for our sample circuit and let the Optimizer do the work! For example, you can set your goals for Gain to be greater than 9 dB and Bandwidth to be greater than 200 MHz etc.
Video reference: Leverage PSpice Advanced Analysis to reduce design cost, improve design reliability, engineer's productivity and manufacturing yield.
Try the OrCAD X free trial yourself and start applying these Advanced Analysis capabilities on one of the many demo designs available in there.
Up Next, Check Out the Second Blog of the Series
2. Grab A Coffee And Let Optimizer In PSpice Do The Work For You! (Part 2 of 4)