11 - Accessing Dynamic BOM with Live BOM
Live BOM is a dynamic BOM that is generated using supply chain data from Sourcengine™. Live BOM provides real time component availability to help you keep track of the cost, time, and risk of the BOM. It represents an up-to-date view of the design BOM with zero configuration. Any changes made to the schematic are dynamically updated in the Live BOM view. The rich user Interface provides easy access to the live part status from the OnCloud libraries.
Displaying Live BOM Data
To launch Live BOM, do the following:
- Choose the Tools – Live BOM menu command. The Live BOM interface displays the design data organized in two distinct views:
-- Tile View - The Tile view shows the dashboard view.
-- List View - The part List view shows the list of parts along with other part details, such as part attributes in BOM sorted in column headers. This is the default view of Live BOM.
The Live BOM data is displayed in the List view.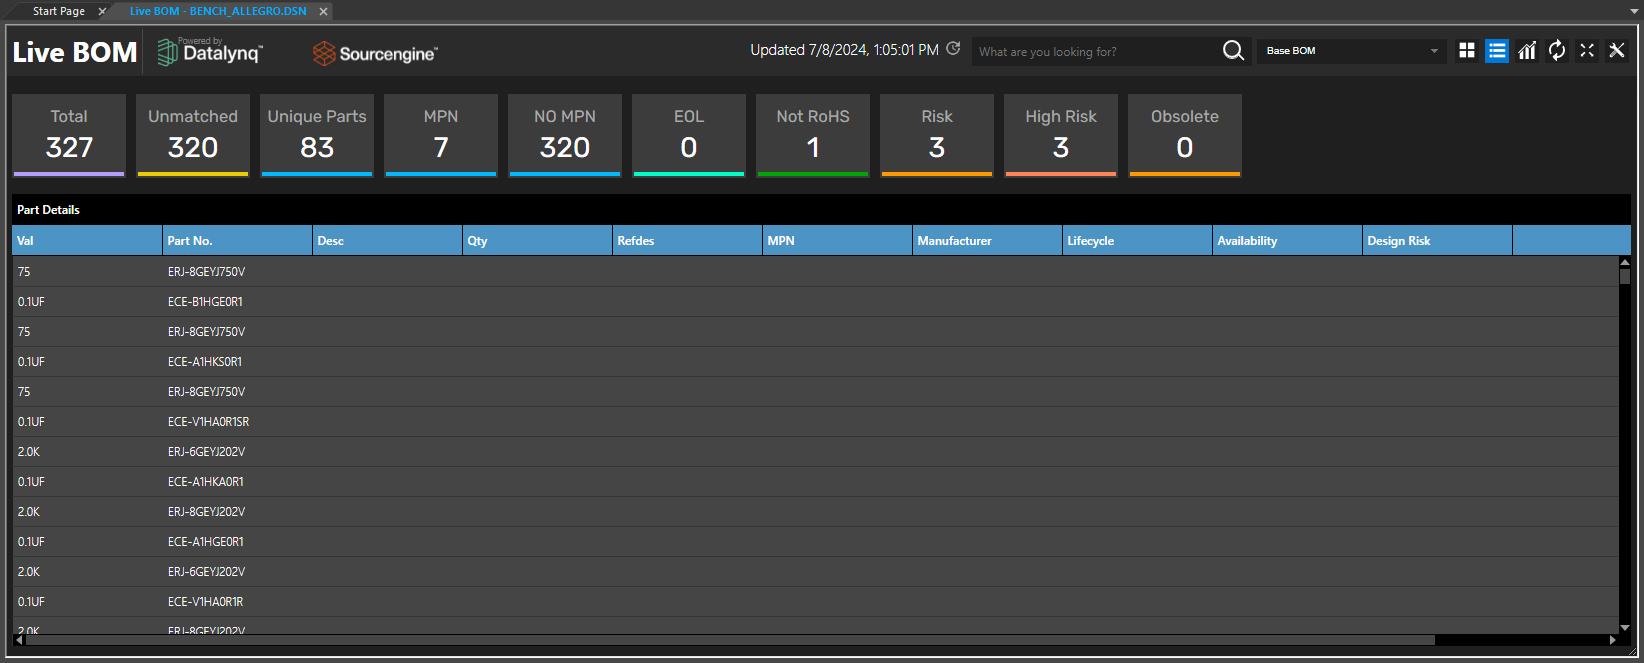
- To switch to the Tile or dashboard view, click the Tile View icon at the top-right corner of the Live BOM tab.
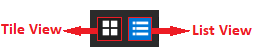
- To switch back to the List view, click the List View icon.
The various sections of the Live BOM interface in the Tile view are explained in the following table:
| Section | Description |
|---|---|
|
Tiles |
Tiles provide a summary view of the BOM. Clicking a tile, displays a list of parts, filtering the results based on the selected tile. 
This summary contains the following information:
|
|
BOM Health |
Displays the overall health status of the BOM:
|
|
Availability |
Displays a pie chart on part availability. |
|
Overall Design Risk |
Depicts the overall risk level about part data:
|
|
Lifecycle |
Displays a pie chart with the distribution of lifecycle status of parts:
|
|
High Risk Parts |
|
|
End of Life Parts |
Lists the parts with the lifestyle status as EOL. |
|
Inventory Risk |
Lists the parts that are at an inventory risk. Inventory risk refers to the possibility of a product being either over-stocked or under-stocked. |
Filtering Live BOM Data
To filter and display the Live BOM data, do the following:
- In the Live BOM interface, select a tile. For example to view a list of unique parts, click the Unique Parts tile.
The selected tile is highlighted and a list of filtered part list is displayed.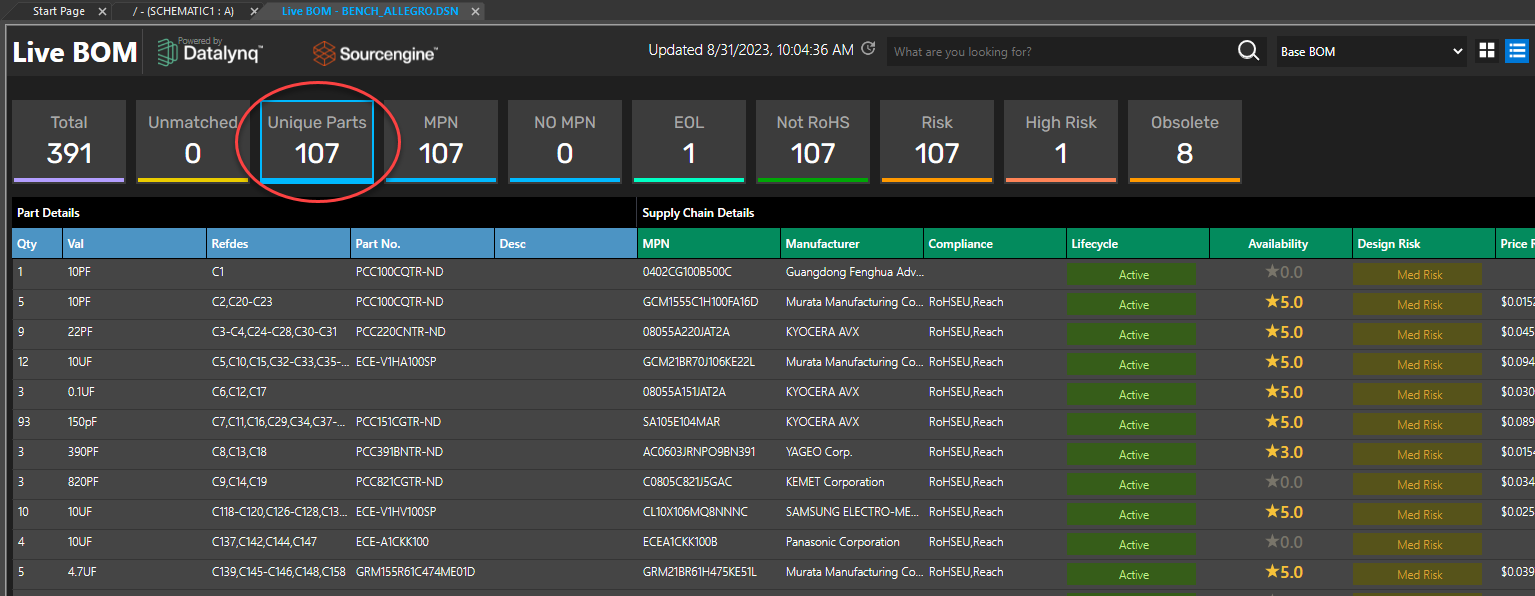
- To apply multiple filters, click another tile. For example, to view unique parts with lifecycle set as Discontinued, click the Obsolete tile while the Unique Parts tile is still selected.
Both the filters are applied and the results are displayed.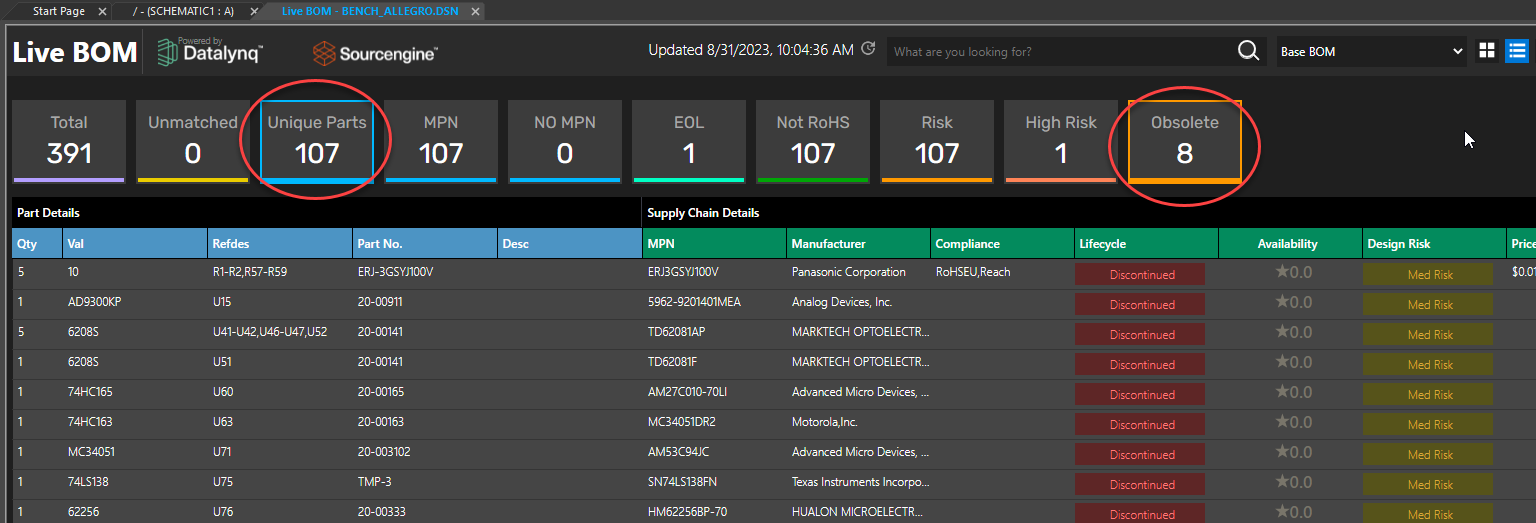
- To remove a filter, click the corresponding tile for that filter. For example, to remove the unique parts filter, click the Unique Parts tile which you selected in step 1.
The unique parts filter is removed and all the part instances with lifestyle as Discontinued are displayed.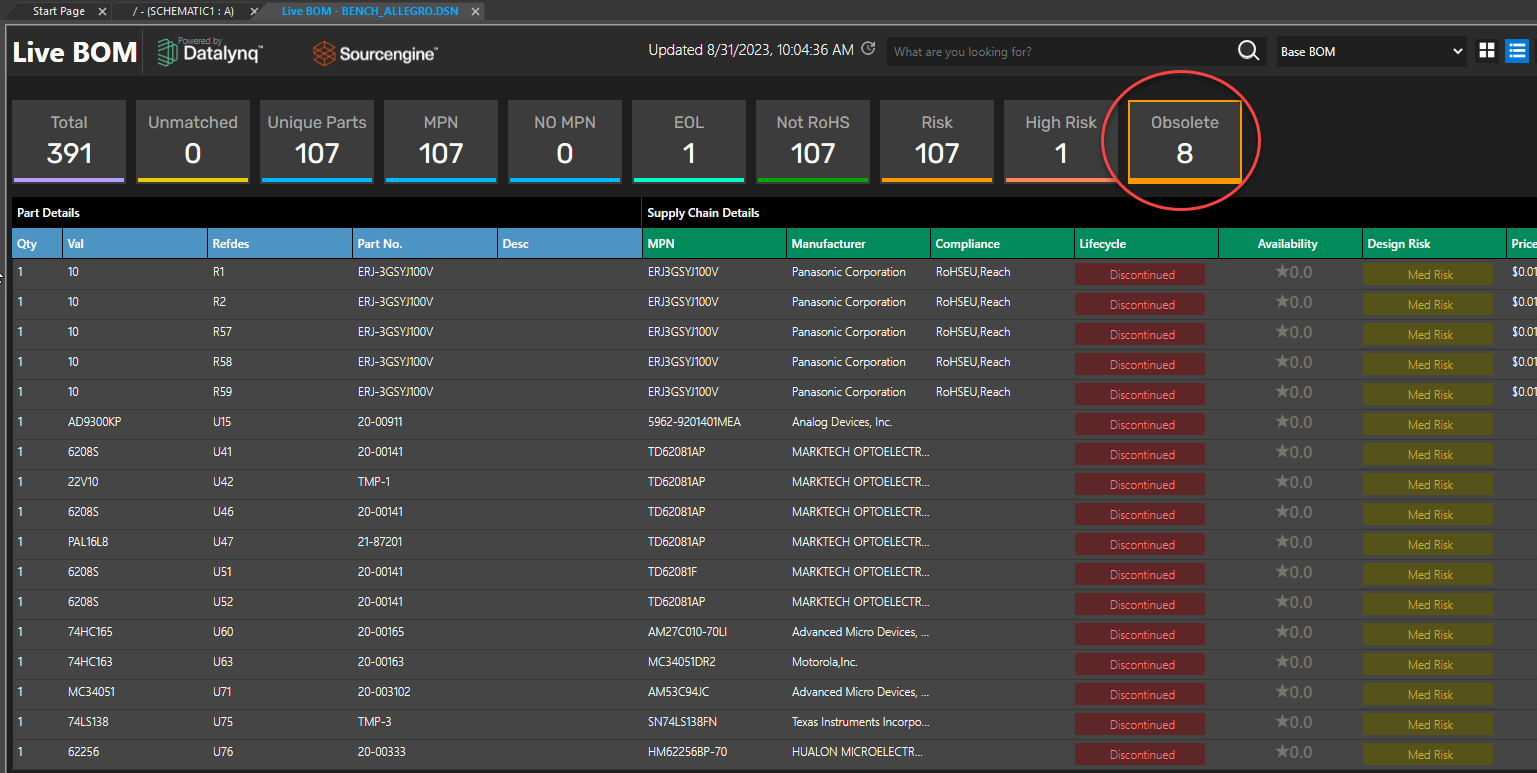
Viewing Part Details
To view part details, do the following steps:
- Click a tile or click the List View icon.
The Part Details section is displayed. By default, the part details display in the expanded mode with one part number per row, that is each part instance is listed in a separate row. - Click the Expand/Collapse icon to display the parts in the collapsed view.
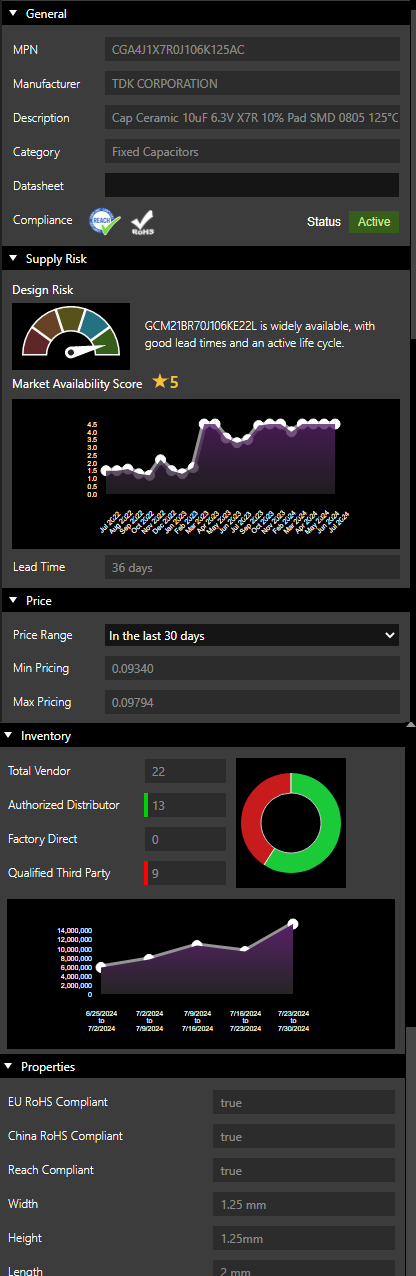
The view changes to one part (refdes) per row, that is a single row represents all the instances of the part. The quantity column is updated with the number of instances of the part. - Click a row to display the Alternate Part section at the bottom of the interface and the Property panel comprising the following sections on the right-side of the interface:
- General
- Supply Risk
- Price
- Inventory
- Properties
The following table describes the sections in the List view:
| Section | Description |
|---|---|
|
Tiles |
Tiles provide a summary view of the BOM. Clicking a tile, displays a list of parts, filtering the results based on the selected tile. |
|
Part Details (blue columns) |
Displays each part with complete part details including the quantity, value, refdes, part number, and description. This data is fetched from the schematic. |
|
Supply chain details |
Displays supply chain details for each part including MPN, manufacturer name, RoHS compliance, lifecycle status, market availability of parts, design risk based on the market availability of parts and alternative parts, and the price range. This data is fetched from Sourcengine. |
|
Alternate Parts |
For the parts with linked MPN, alternative parts from Sourcengine appear in the bottom panel of the Live BOM interface. On selecting a part with an associated MPN and manufacturer name in the Part Details section, the Alternate Parts section displays a pie chart with distribution of lifecycle status of the available alternative parts. Alternative parts are listed on the right of the pie chart. You can replace a part in the Part Details section with one of the alternative parts listed here. |
|
Property panel |
The Property panel includes the following sections:
|
Replacing a Part with an Alternative Part
To replace a selected part with an alternative part, do the following:
- Select a part row in the Part Details section.
The Alternate Parts section opens at the bottom of the interface.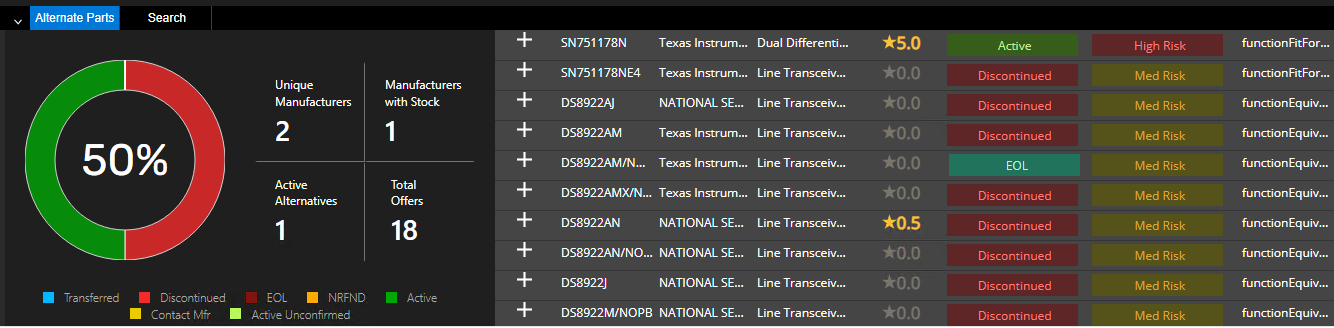
- Select a part row in the Alternate Parts section.
- Click the Replace icon (+) on the left of the row.
The part is replaced with the alternative part.
Schematic Updates
When you replace a part in Live BOM with an alternative part from Sourcengine, the schematic is updated with the changes as soon as you switch to the schematic view.
Customizing Live BOM Display
The Live BOM interface provides controls to change the way the data is displayed.
- To customize the display of the Live BOM data, select the corresponding control from the top-right corner of the Live BOM interface.

The following table provides a functional description of the controls:
| Control | Description |
|---|---|
|
Updated Date and Time |
Displays the most recent date and time when the schematic data was synced with the Live BOM data. |
|
Search bar |
Searches the Live BOM data for the specified search string and displays results in the Part Details grid. |
|
BOM Selection |
Provides the option to display the data from the Base BOM or any of the available variants. This drop-down list includes all the variants of the design and the Base BOM.The Base BOM is selected by default. 
When you select a variant, only the parts used in the variant are displayed. Any part marked as DNI in the variant is removed from the variant view. If you replace a part with an alternative part in a variant BOM, it is replaced only in the variant. The Base BOM and any other variants remain unaffected. The tiles at the top display the data in accordance with the selected view. |
|
Live BOM view |
You can choose between:
|
|
Forecast |
Displays the forecast trends |
|
Refresh |
Reloads the BOM data. |
|
Expand/Collapse |
|
|
Configuration |
Displays the Configuration dialog box, where you define aliases of the part attributes to be displayed instead of property names. |
|
Schematic Update |
Updates the schematic with the part changes done in Live BOM. |
Configuring Display of Part Attributes
You can configure Live BOM to display custom column headers for part attributes in place of the property names from the schematic, CIS database, or Sourcengine. You can also remove the default column headers and add more from any of the three sources.
To display custom column headers in the Part Details or Supply Chain Details section, do the following:
- Select the Configuration icon from the top-right corner of the Live BOM interface to open the Columns and Alias pane.
- Select the desired checkbox:
- Schematic – Schematic instance
- CIS Cloud – Component database
- Sourcengine – Supply chain
The Attribute column displays the names of the attributes in the selected source—Schematic, CIS, or Sourcengine. - Specify a display name for an attribute in the cell under the Alias column.
- Click Add New Property to display more schematic, CIS, or Sourcengine properties as columns in Part Details.
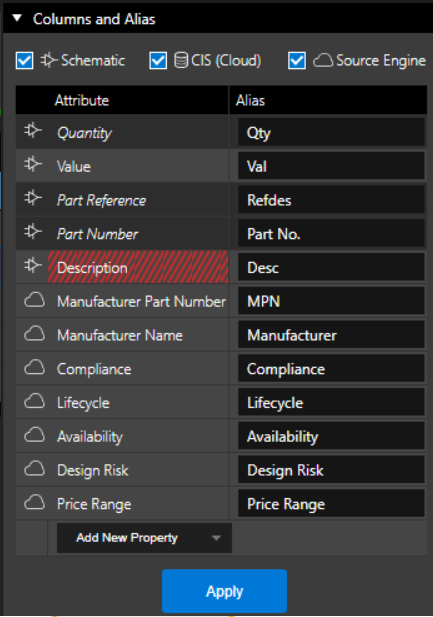
- Select PCB Footprint from the Schematic properties.
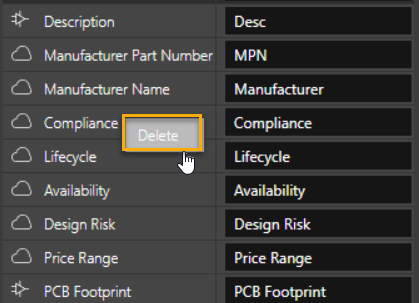
You can also remove a property from the list of displayed columns. - Right-click a property and choose Delete.
- Click Apply.
The columns are updated.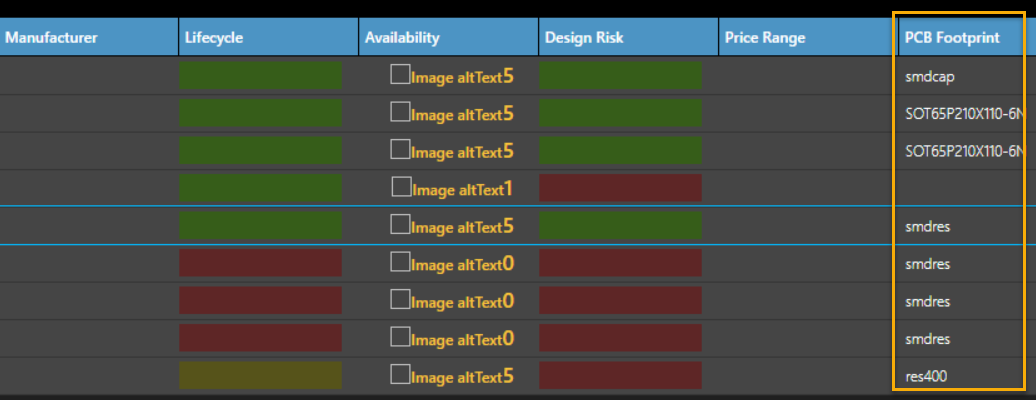
Configuring Manufacturer Details
You can configure manufacturer details, such as the manufacturer name and MPN to map the Live BOM properties with the corresponding schematic property. This mapping makes the existing CIS database designs compatible with Live BOM without any additional steps.
To configure manufacturer details, do the following:
- Choose Options – Extended Preferences.
The Extended Preferences Setup dialog box opens. - Select Live BOM in the Extended Preferences node.
- Specify the schematic properties that correspond to the following Live BOM properties:
- Manufacturer Name
- Manufacturer Part Number
- Click Ok.
Cross-Probing Between Live BOM and Schematic
To locate a part displayed in the part list on the schematic, you can cross-probe between
Live BOM and the schematic.
- In the Part Details list, right-click a part row and click Cross Probe.
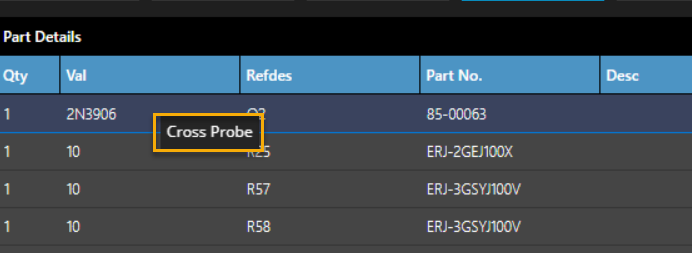
The corresponding part is highlighted on the schematic page.
Forecasting Trends using Predictive Analytics
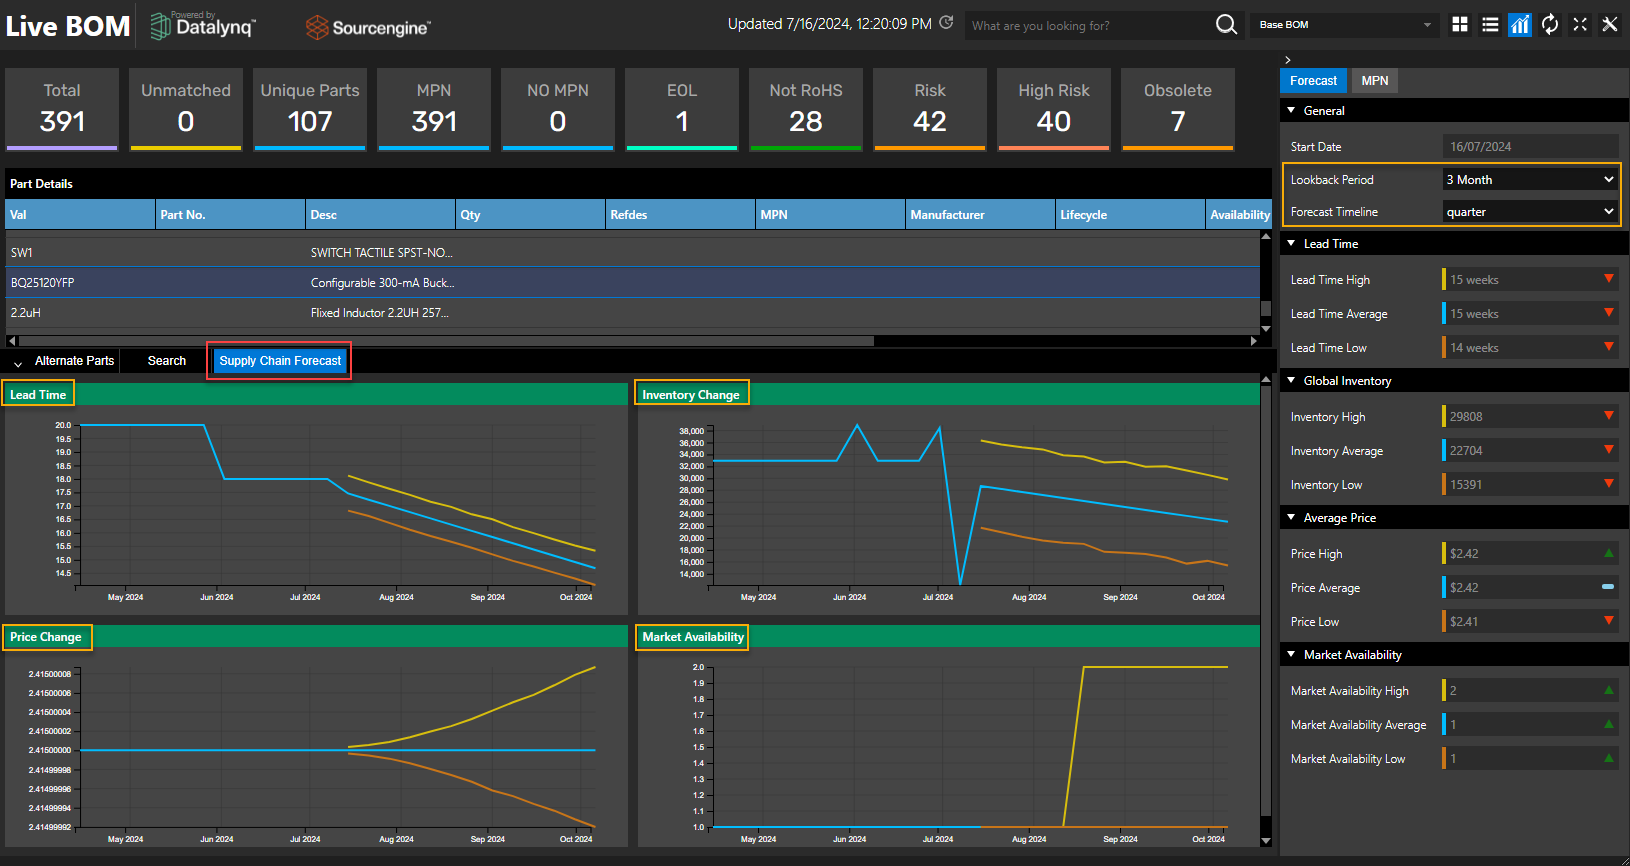
Live BOM provides support for predictive analytics of trends in lead time, inventory change, price change and market availability. You can view historical data for the specified lookback period and future trends for the specified forecast duration.
Displaying Forecasting Trends
To display the Supply Chain Forecast tab and the Forecast pane, do the following:
- Select the Forecast icon from the top-right corner of the Live BOM interface.
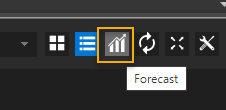
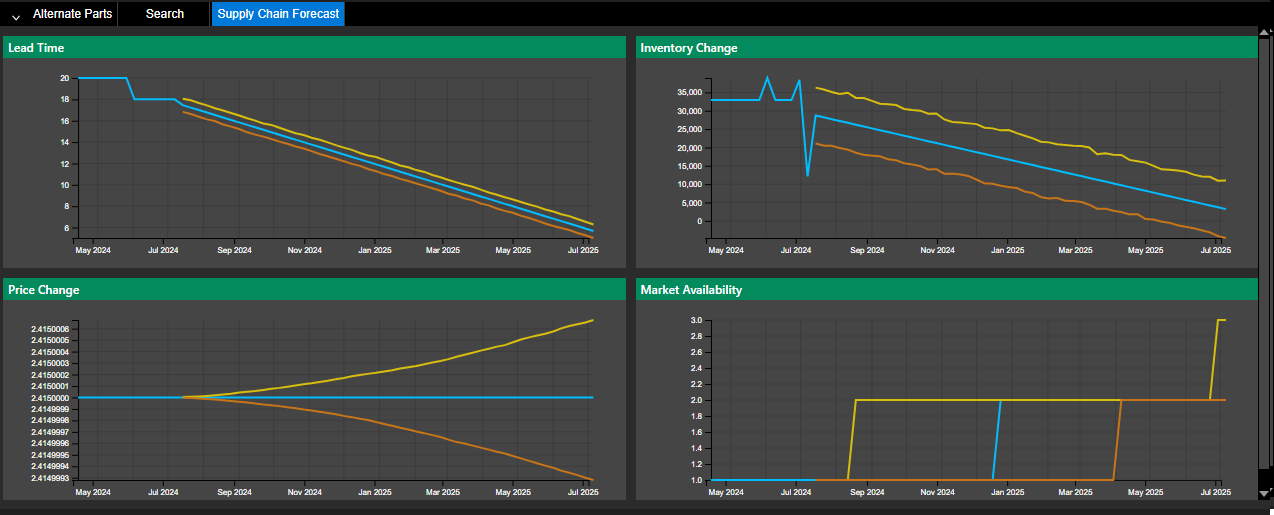
The Supply Chain Forecast tab provides various forecast trends in the following four graphs:- Lead Time
- Inventory Change
- Price Change
- Market Availability
- Hover the mouse cursor over any point in the curve.
All the details at that point in the graph are provided in a datatip.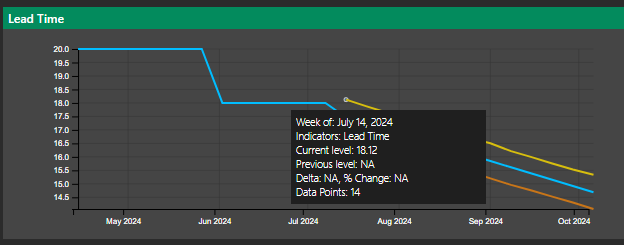
Viewing Past and Future Trends
The trend is displayed for the lookback (past) period of a quarter from the current date and the forecast for the next quarter, by default. Forecast period is a period of time over which a forecast is applicable.
To view the past and future data trends for modified timelines, do the following:
- Select the required period from the Lookback Period drop-down list to change the lookback period.
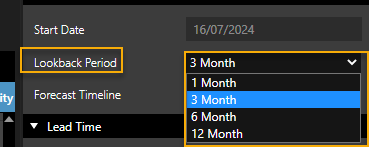
The data is immediately refreshed and updated trends are displayed.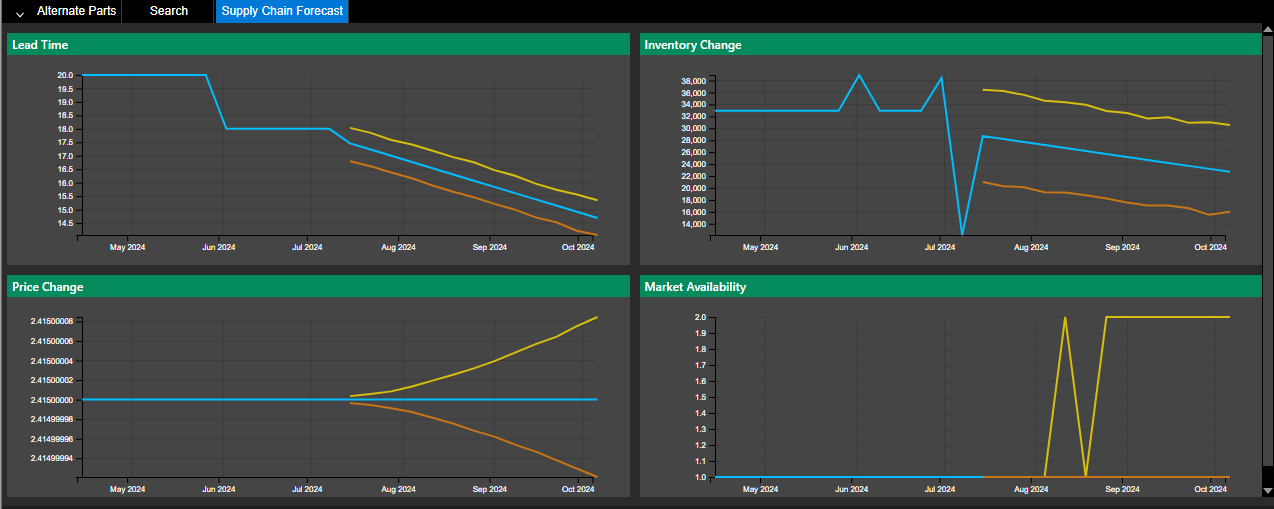
- Similarly, define the forecast timeline, as required. The default is quarter.
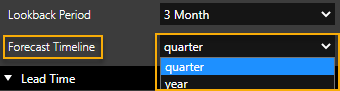
The supply chain forecast is updated to reflect the updated timeline.
View the next document: 12 - Creating Reports
If you have any questions or comments about the OrCAD X platform, click on the link below.
Contact Us